Stable isotopes can be used to study metabolic pathways and turnover rates of biological molecules such as proteins, peptides, RNA and others.
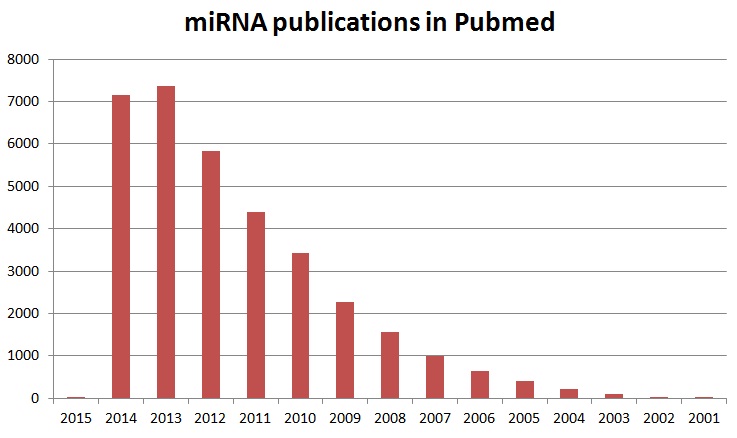
Stable isotopes were used to define metabolic pathways and turnover of biological molecules in the body shortly after the discovery of deuterium in 1931, the heavy isotope of hydrogen, by Harold Urey. Urey received a Nobel Prize in 1934 for this discovery. Already in 1935 Rudolf Schoenheimer used isotopic tracer techniques in metabolic research. His work, for the first time, provided clear experimental evidence of the dynamics of the body’s metabolism. Schoenheimer’s research group defined synthesis and degradation pathways of many compounds in the following years. The availability of enriched 15N, the heavy isotope of nitrogen, enabled demonstrating that protein had a dynamic life cycle in that they were both continually being synthesized and degraded. However, all of this early work was performed using crude methods that involved the preparation of labeled compounds, followed by tedious measurements using isotope ratio mass spectrometry (IRMS). In addition, for the measurements of the isotopic enrichment, all compounds investigated needed to be reduced to the simple gases carbon dioxide (CO2), hydrogen (H2), and nitrogen (N2). After World War II, the radioisotopes tritium (3H) and carbon 14 (14C) were mostly used for many years to come. Improvements made in instrument development, specifically for gas chromatography-mass spectrometry (GC/MS) and liquid chromatography-mass spectrometry (LC/MS) instruments, allowed the use of stable isotopes for metabolic and proteomic studies with more ease in recent decades. The increasing trend for the use of isotopes, in particular the use of stable isotopes for metabolic or proteomic studies, is reflected in the increased publication volume of papers covering these applications which can be seen in figure 1. More than 18,500 publications for isotope labeling have been published since 1953 and can be found in PubMed.
.png)
Figure 1: Timeline of papers in PubMed describing various isotope labeling methods and applications. As can been seen the use of isotopes, in particular stable isotopes, has increased in recent years.
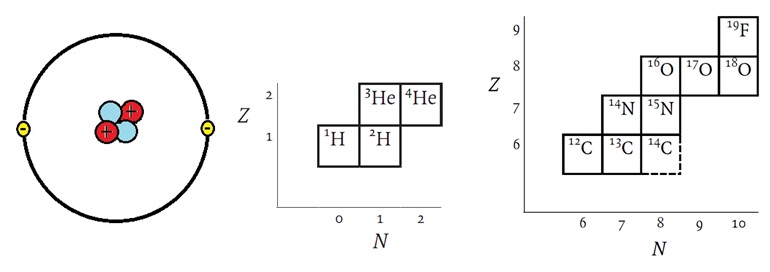
Figure 2: The helium, as an example, has 2 protons, 2 neutrons, and 2 electrons. Helium has two isotopes but it consists almost entirely of He-4 with natural He only containing little more than 0.0001% of He-3.
Let us briefly review the basic chemistry and physical properties of isotopes. Elements contain nuclei each with their own unique physicochemical characteristics. According to the “atomic theory”, each atomic nucleus can be defined by its mass, its number of constituent elementary particles, its spin rate, its magnetic strength, its electric charge, and its multitude of existing forms. The uniqueness of elements is reflected in their characteristic ratio of isotopes. This phenomenon has allowed geological scientists to study the geological record of the earth’s crust revealing its history. Carbon dioxide (CO2) and methane (CH4) in the atmosphere record its history and the impact of human beings on the Earth’s atmosphere which can be studied from ice cores, for example taken from glaciers or eternal ice fields, in the Alps, in Greenland or in the Antarctic. Atoms are the smallest units of elements that exist in nature. Every atom consists of protons, neutrons, and electrons. Nuclides are a specific type of atoms or nuclei. Every element, E, or AZE  , can be defined by its atomic number, Z. This so-called “atomic number”, Z, is the number of protons in the atomic nucleus. In electrically neutral atoms it is also the number of electrons. However, the atomic mass or atomic weight is the sum of the masses of protons, neutrons, and electrons. The atomic mass or the mass number of heavy particles made up of neutrons also called nucleons, can be defined as A = Z + N + ne, where A is the “mass number” , Z is the number of protons, N is the number of neutrons, and ne is the number of electrons. Since electrons are ~1,836 times lighter than the hydrogen atom A is usually expressed as the sum of Z and N.
A few definitions as they relate to isotopes follow.
Mass number: A: A = Z + N
Protein: The proton is a nuclear particle with the charge number +1, a spin quantum number ½, and a rest mass of 1.007276470(12) u.
Neutron: The neutron is a nuclear particle of zero charge, a spin quantum number ½, and a mass of 1.008664905(14) u.
Electron: The electron is an elementary particle that is not affected by the strong force. The electron has a spin quantum number ½, a negative charge and a rest mass of 0.00054879903(13) u.
Atomic mass constant:
The atomic mass constant, u or mu, is defined as one 12 (1/12) of a carbon 12 atom in its nuclear and electronic ground state. u = mu = 1.6605402(10) x 10-27 kg = amu, atomic mass constant. Therefore the mass of a proton equals 1.007276 amu, the mass of a neutron equals 1.008665 amu, and the mass of an electron equals 0.00054858 amu.
Atomic mass or weight:
Usually the atomic mass or weight is the average mass of all atoms in an element calculated from the relative abundance of the naturally occurring isotopes of the element.
Atomic mass unit:
The atomic mass unit (symbolized AMU or amu) is defined as precisely 1/12 the mass of an atom of carbon-12. The carbon-12 (C-12) atom has six protons and six neutrons in its nucleus.
In imprecise terms, one AMU is the average of the proton rest mass and the neutron rest mass. This is approximately 1.67377 x 10 -27 kilogram (kg), or 1.67377 x 10 -24 gram (g). The mass of an atom in AMU is roughly equal to the sum of the number of protons and neutrons in the nucleus. For example, in the case of oxygen, each isotope of this element has the same number of protons, Z = 8. Oxygen has three stable isotopes, A = 16, A = 17, and A = 18. From the sum of nucleons it is evident that these contain N = 8, N = 9, and N = 10 neutrons, respectively, within their nuclei, so that they produce the three mass numbers for oxygen. The notations of these are written with the mass number as a preceding superscript: 16O, 17O and 18O.
Table : Isotopes and their natural abundance commonly used as tracers in biological experiments
Z | Name | Symbol | Mass of Atom (u) | Abundance in % |
1 | Hydrogen Deuterium Tritium | 1H 2H 3H | 1.007825 2.014102 3.016049 | 99.9885 0.0115 * |
6 | Carbon | 12C 13C 14C | 12.000000 13.003355 14.003242 | 98.93 1.07 * |
7 | Nitrogen | 14N 15N | 14.003074 15.000109 | 99.632 0.368 |
8 | Oxygen | 16O 17O 18O | 15.994915 16.999132 17.999160 | 99.757 0.038 0.205 |
15 | Phosphorus | 31P | 30.973762 | 100 |
16 | Sulphur | 32S 33S 34S 36S | 31.972071 32.971458 33.967867 35.967081 | 94.93 0.78 4.29 0.02 |
The heavy isotopes most often used for metabolic studies are deuterium, 2H, heavy carbon, 13C and heavy nitrogen, 15N. Labeled amino acids and peptides plus tagging molecules are now commercially available. Virtually almost any labeled peptide can be synthesized using Fmoc-chemistry based automated synthesis.
IRMS
Isotope ratio mass spectrometry (IRMS) is a technique that has found an increasingly widespread use in archaeology, medicine, geology, biology, food authenticity, and forensic science. IRMS instruments have the ability to accurately and precisely measure variations in the abundance of isotopic ratios of light elements such as 13C/12C, 18O/16O, D/1H, 15N/14N, and 34S/32S. The ratios of these isotopes always need to be measured relative to an isotopic standard in order to eliminate any bias or systematic error that can occur during the measurements. IRMS provides information about the geographic, chemical, and biological origins of substances. The relative isotopic abundances of elements in the studied material allow determination of the source of an organic substance. Isotope ratios of elements, such as carbon, hydrogen, oxygen, sulfur, and nitrogen, can become locally enriched or depleted through a variety of kinetic and thermodynamic factors. The isotope ratios allow differentiation of samples which otherwise share identical chemical compositions.
Labeling of cell compartments with stable isotopes avoids the use of radioactive tracer or labeling compounds. However, similar to radioactive isotopes, stable isotopes can be incorporated into bio-molecules without any changes in their chemical structure. Stable isotopes commonly used include deuterium, 2H, heavy nitrogen, 15N, heavy carbon, 13C and heavy oxygen, 18O. After incorporation into metabolic molecules, for example by metabolic labeling of cells, compounds containing these stable isotopes are detected in a mass spectrometer (MS) due to their increased mass when compared to natural light isotopes.
During the last decades classical protein analysis has evolved into proteomics resulting in a flood of new improved technologies and approaches for the study of cells and their compartments. Even though genes encode and regulate proteins, it is the proteins that are responsible for most life functions and usually make up the majority of structures in cells or tissue. These large complex molecules are synthesized from smaller subunits called amino acids. The chemical nature of the 20 natural amino acids found in proteins determine their specific three-dimensional (3D) structures and define the particular function of a protein in the cell. The proteome refers to the entire set or complement of proteins that is or can be expressed by a cell, tissue, an organism or an organelle. Unlike the genome the proteome is more dynamic and changes from minute to minute in response to external and internal chemical cues. The chemistry of a protein is determined by its sequence as well as by the number and nature of other proteins or molecules it interacts with in the cell. Due to its complexity, proteomics, the study to explore protein structures and activities in an organism, will be the focus of research for many years to come. The Human Genome Project generated a flood of genomic and ultimately proteomic data which analyses will continue for many years.
The Human Genome Project (HGP) was a 13-year project coordinated by the U.S. Department of Energy (DOE) and the National Institutes of Health that was completed in 2003. The goal of this project was to identify all the approximately 20,500 genes in human DNA, determine the sequences of the 3 billion chemical base pairs that make up human DNA, store this information in databases, improve tools for data analysis, transfer related technologies to the private sector, and address the ethical, legal, and social issues (ELSI) that may arise from the project. [Source:http://web.ornl.gov/sci/techresources/Human_Genome/publicat/jmmbbag.pdf;http://genomics.energy.gov/, http://www.proteinatlas.org/.]
Presently, there is no clear consensus among scientists which isotope labeling strategy is the best one to use or is considered to be the “best labeling practice”. Ultimately, the selection of the isotope labeling technique will dependent upon experimental design, the scope of a particular analysis and the sample or system being analyzed. However, quantitative analysis of proteins and peptides is a very important issue in mass spectrometry based proteomics. During the last decade several isotope labeling techniques have been developed and introduced. These labeling techniques allow studying protein structures with the help of mass spectrometry based approaches or nuclear magnetic resonance (NMR) based experiments or techniques. Improvements made in both technologies have greatly expanded the range of biological applications that can now be studied.
Types of isotope labeling methods that were developed since the 1960s are:
- Uniform labeling with the stable isotopes 13C, 15N, and 2H.
- Differential labeling of proteins and peptides.
- Amino acid type selective labeling.
- Site-specific labeling.
- Random or fractional labeling.
- Specific protonated amino acids against a deuterated background.
- Selective incorporation of 15N-labeld amino acids against an unlabled (12C/14N) background.
- Methyl specific protonation.
- Segmental labeling.
- Stereo-arrayed labeling.
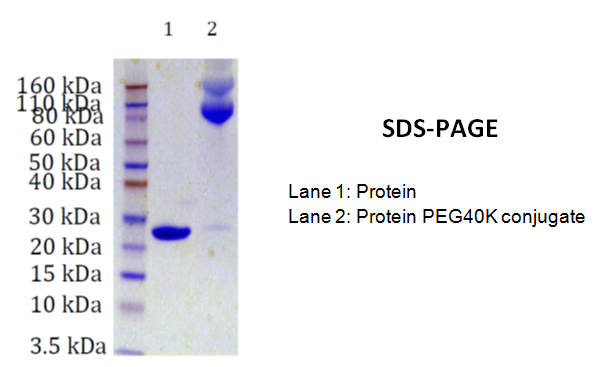
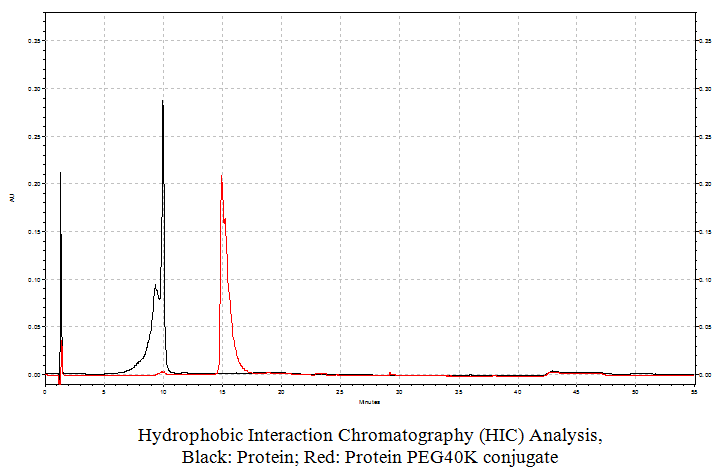
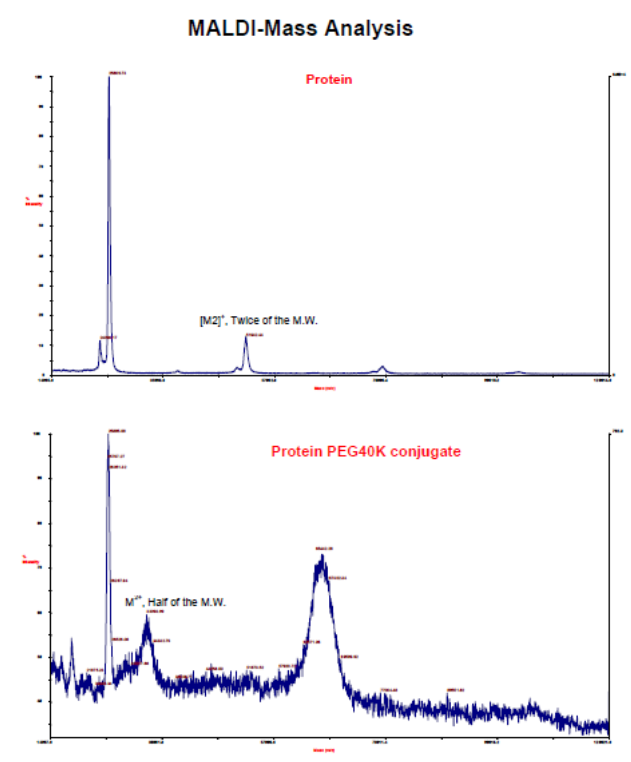
Recombinant proteins have now become an important part of medicine. These therapeutic proteins are used for the treatment of many different diseases. Unfortunately, proteins can have posttranslational modifications (PTMs) that may occur during manufacturing and storage. The result is product-related impurities. With improvements made in mass spectrometry instrumentation mass spectrometry is now being widely used for the characterization of recombinant proteins and their PTMs. The used of liquid chromatography coupled with mass spectrometry (LC-MS) and search algorithms makes it possible to identify hundreds of PTMs in a single LC-MS analysis. However, the quantification of PTMs using mass spectrometry is challenging. To address this problem many approaches using stable isotope-labeled internal standards have been developed. The goal is to provide accurate and precise quantification of proteins. In addition, many different approaches can be used to introduce stable isotopes into the sample.
Reference
Atreya, Hanudatta S. (Ed.); Isotope labeling in Biomolecular NMR. Series: Advances in Experimental Medicine and Biology, Vol. 992, 2012, VIII, 219 p. 75 illus., 45 illus. in color.
Cambridge Isotope Laboratories, Inc.: http://www.isotope.com/
Donald Clayton; Handbook of Isotopes in the Cosmos. Hydrogen to Gallium. August 2007. Cambridge University Press. www.cambridge.org. isbn: 9780521530835
Xinzhao Grace Jiang, Izydor Apostol, Quanzhou Luo, Jeffrey Lewis, Ronald Keener III, Shun Luo,
Matthew Jerums, Xin Zhang, Jette Wypych, Gang Huang; Quantification of protein posttranslational modifications using stable isotope and mass spectrometry. I: Principles and applications. Analytical Biochemistry 421 (2012) 506–516.
Link to the Pandey Lab: http://www.silac.org/
Zeland Muccio and Glen P. Jackson; Isotope ratio mass spectrometry. First published as an Advance Article on the web 14th November 2008. DOI: 10.1039/b808232d.
Ray H. Liu, Dennis V. Canfield, Sheng-Meng Wang; Quantitation and Mass Spectrometric Data of Drugs and Isotopically Labeled Analogs. Published: August 5, 2009 by CRC Press.
Karen A. Sap and Jeroen A. A. Demmers (2012); Labeling Methods in Mass Spectrometry Based Quantitative
Proteomics, Integrative Proteomics, Dr. Hon-Chiu Le ung (Ed.), ISBN: 978-953-51-0070-6, InTech, Available
from: http://www.intechopen.com/books/integrative-proteomics/labeling-methods-in-mass-spectrometry-bas
ed-quantitative-proteomics
Warscheid, Bettina (Ed.); Stable Isotope Labeling by Amino Acids in Cell Culture (SILAC). Methods and Protocols. Methods in Molecular Biology, Vol. 1188, 2014, XIV, 372 p. 65 illus., 27 illus. in color. Humana Press.
D. Rodriguez, G. Audi, J. Aystö, D. Beck, K. Blaum, et al.. Accurate mass measure-
ments on neutron-defcient krypton isotopes. Nuclear Physics A, Elsevier, 2006, 769, pp.1-15.10.1016/j.nuclphysa.2006.02.001.in2p3-00025070

.jpg)


.jpg)